Benefits Maps – Painting by numbers
Quantifying the Map
‘A picture is worth a thousand words’. But words and pictures are not sufficient if you want to be sure your programme will succeed. You need to quantify if you hope to fructify.
You may already be familiar with putting numbers on a benefits map, as in the example below. Figure 1 shows a benefits map for a programme aiming to increase profits due to improvements in customer service. In this case study, strategic analysis has shown that customer satisfaction with after-sales support enhances business results and has the potential for delivering a benefit of €300,000 per annum compared with the current level of business.
However, this will also increase operational costs by 25%. The steps to achieving this benefit have then been derived from the strategic outcome of ‘M: Increased Profit’ all the way across to defining the component projects. These projects focus on creating a help-desk as a new service aimed at solving the strategic issue. Reading from right to left, you can see where the benefit is coming from. From left to right, you can understand where the projects are heading.
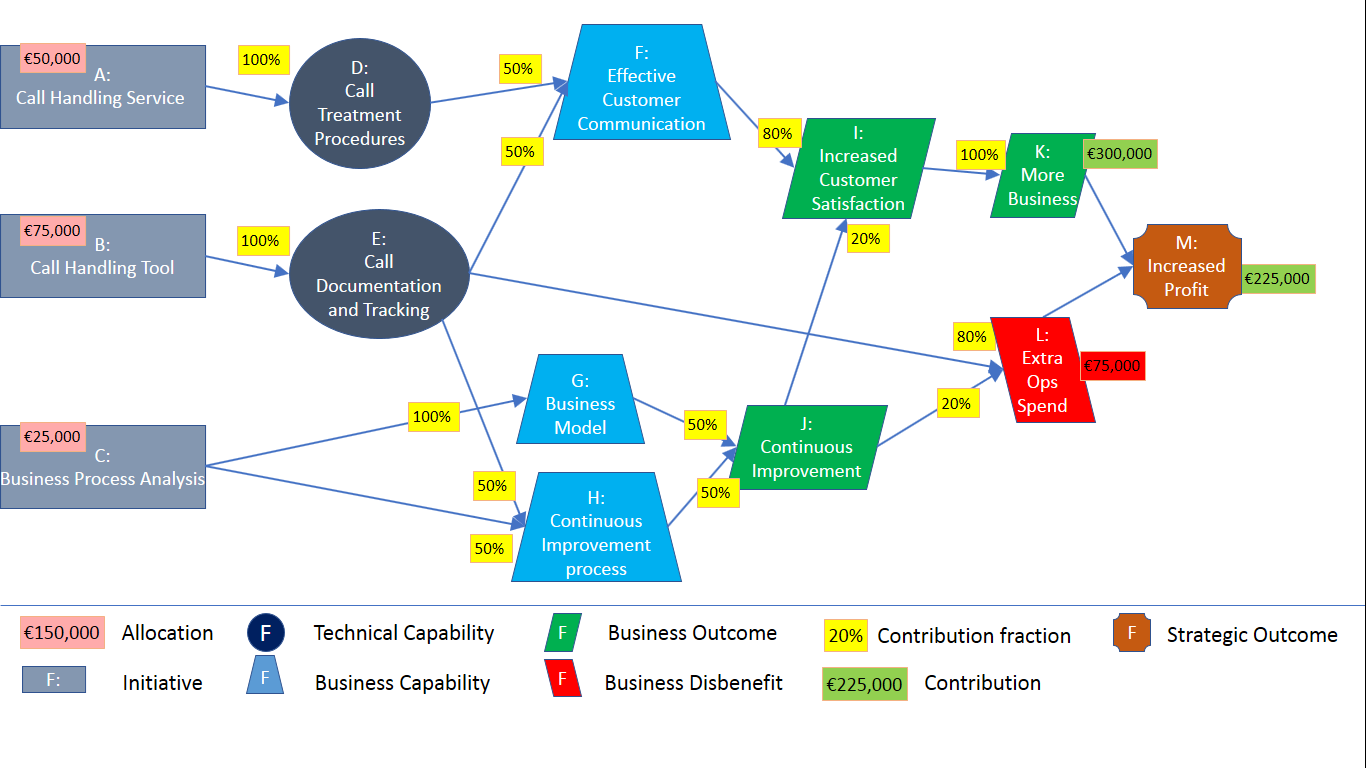
Figure 1: Benefits Map with Contribution Fractions
The amount that each step contributes to the value of the next one has been estimated as a percentage of the destination value (the “contribution fraction”. For any node, the sum of the contribution fractions is 100%). These percentages are shown on the same map. The disbenefit created by the increased operational spend is shown as a negative value. The cost of each component project (the financial “allocation”) is also shown – estimated, one hopes, completely independently of the forecast business value of the entire programme.
Once you have obtained the estimates for the business benefits, you can work from right to left, using the contribution fractions, to calculate the corresponding value of each of the nodes in the benefits map. In the example, the profit (node M) is generated by the contribution of extra business (K) but must consider the disbenefit of adding to operational costs (L). From the numbers in the diagram, this means that extra business generates €300,000 and that €75,000 needs to be spent on additional operational work.
You can work your way ‘back’ (from right to left) across the entire map in this way to evaluate the contribution that each node makes to achieving the forecast benefit numbers. These numbers can, and should, be the basis for both the overall business case, as well as for the individual business cases for the component projects and serve to ensure consistency across the whole model. The importance of consistency is explained in Reference 2.
Two Approaches to Dealing with Disbenefits
Simplified Model
Management has decided to simplify the model described above by integrating the effect of the disbenefit into the affected node. This entails removing nodes L (Extra Operational Spend) and M (Increased Profit) and making node K (More Business) the strategic objective with - as before - a benefit value of €225,000 (i.e. 75% of €300,000). The corresponding map is shown below in Figure 2.
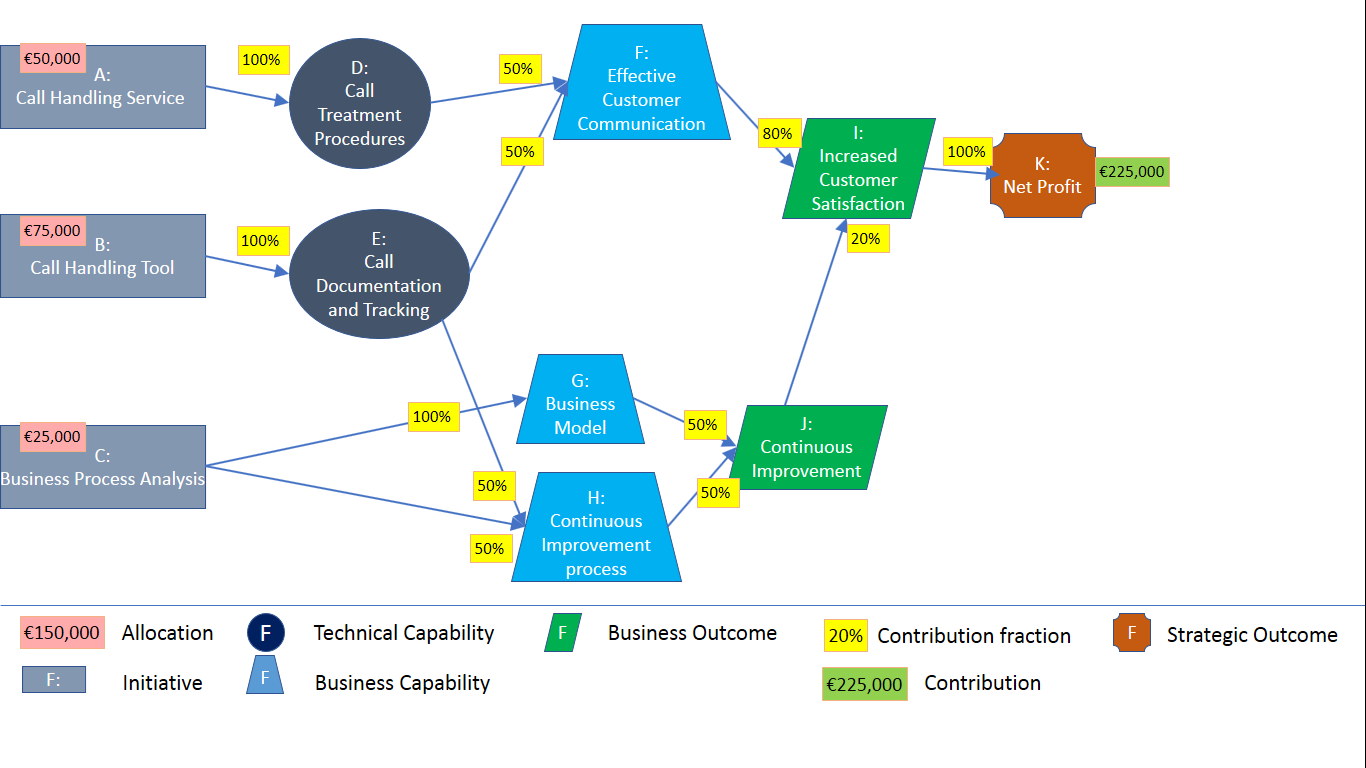
Figure 2: Simplified Model of the Programme
Calculating the simplified model from right to left, delivers the following contributions, all of which show a positive ROI of contribution vs. cost:
- A: Call Handling Service contributes €90,000 (cost = €50,000)
- B: Call Handling Tool contributes €101,250 (cost = €75,000)
- C: Business Process Analysis contributes €33,750 (cost = €25,000)
Original Model
However, if we investigate the original approach and analyse the model that explicitly includes the disbenefit by including nodes L and M (as per figure 1) the results for the contributions are quite different:
- A: Call Handling Service contributes €120,000 (cost = €50,000)
- B: Call Handling Tool contributes €71,250 (cost = €75,000).
This project contributes less to the programme benefits than it costs. - C: Business Process Analysis contributes €33,750 (cost = €25,000)
The reason for this change, from the previous analysis, is that the call handling tool (node B) has a double effect on increasing the operational costs: indirectly, via the continuous improvement work (H), and directly, because it needs to be actively managed. (See link from E to L). The €3,750 “overspend” (€75,000 - €71,250) must be compensated – or cross-subsidised - by the benefit from the call handling service (node A) that it enables.
You might be tempted to ask: “why does it matter when the individual numbers for the component projects do not change the ROI of the overall programme?” The answer is that the benefits map is not only used for making the investment decision for the total programme. The results of the analysis should also be used for tracking progress for each project and for each outcome.
If the detailed numbers against which you are tracking do not correspond correctly to the real business plan, then your tracking will be misleading, resulting in faulty conclusions and unsafe decisions further down the line.
On the other hand, once you have the correct numbers, they can be used in benefits-focused forecasting and tracking methods based on the Earned Benefit algorithms as explained in my book. (Ref. 3 below)
Key Messages
The example underlines two important messages that apply to all programmes:
1) Over-simplifying assumptions can lead to faulty analysis of the benefits model, and result in incorrect decisions later in the programme.
2) The synergy between programme components can justify approving component projects that, on their own, show a negative return on investment. Any such decisions need to be understood and accepted by the governance authority in charge of the programme.
References
- Introduction to benefits mapping webinar, Judge Matharu (December 2018) https://www.apm.org.uk/news/introduction-to-benefits-mapping-webinar/
- Lies, damned lies, and business cases blog entry, John Thorp April 2017) https://www.apm.org.uk/blog/lies-damn-lies-and-business-cases/
- Earned Benefit Programme Management, Aligning, Realizing and Sustaining Strategy. Piney, C. CRC Press, New York, NY, USA. 2018 https://www.crcpress.com/Earned-Benefit-Programme-Management-Aligning-Realizing-and-Sustaining-Strategy/Piney/p/book/9781138033122

Crispin Piney (known as “Kik”) has been involved in the project world since joining the IT Group at CERN, the European Laboratory for Particle Physics, in 1970. He later moved to the Digital Equipment Corporation (DEC), and left in 2000 to work as an independent trainer and consultant.
He has also invested enthusiasm, time, and effort working as a volunteer with the Project Management Institute (PMI®) on the majority of their standardization efforts – project, program, portfolio, risk, Earned Value, Organizational Project Management, scheduling, Work Breakdown Structures, competency development, etc. On the way he has acquired the PMP®, PgMP® and PfMP® certifications.
Kik Piney is author of the book Earned Benefit Program Management, published by CRC Press in October 2017.
0 comments
Log in to post a comment, or create an account if you don't have one already.