Project, programme, portfolio management, data and the possibilities
I recently presented at an APM webinar entitled “Taking portfolio benefits management to the next level with modern analytics”. The feedback was very positive – see some of the comments below:
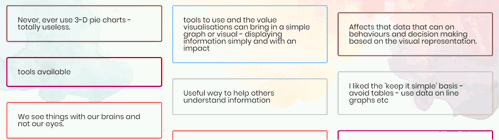
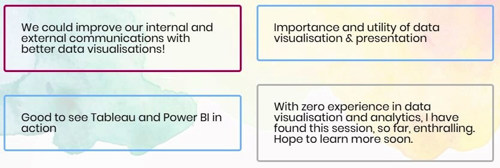
It would seem, from this small selection of comments, that there is a hunger to do more with data in the profession. Most attendees seem to believe that they could achieve better results or improve efficiencies with effective data usage. Want to know more about programmes and portfolios? Read more about project programme and portfolio management.
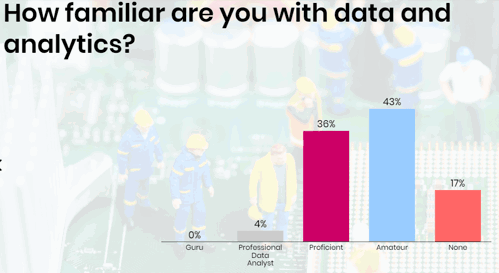
Sixty percent of those present, however, had little experience in the world of data:
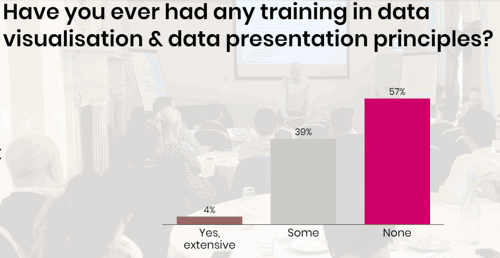
Also few had been given formal training:
Finally, it would seem that almost 90% of organisations do not have a coherent strategy regarding their data management or analytics:
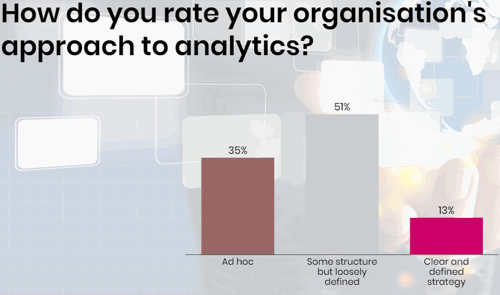
A sorry state!
But this is a situation that can be hugely improved with a little thought, effort and training delivered incrementally, over time.
Why bother? Pick which of these apply to your organisation:
- We are doing it badly
- It takes us a lot of time
- The current reports are not used
- We don’t understand the current reports
- We get conflicting numbers
- We want to cut errors
- We want to improve efficiency
- We want to increase profits
- We don’t understand the extent of the hidden costs of manually creating our current reports
- We want our staff to be analysing data to support better decision making rather than cleaning and merging data manually
If any of these ring true don’t you have a responsibility to yourself or your organisation to get better? Ultimately the effective use of data could give you a competitive advantage in your sector – let’s face it most of the other P3M players are not doing this well (as we saw from the survey responses above). If you are in the construction industry, as the majority of attendees were, you can almost definitely get ahead!
So how do we go about improving our data and analytics offering or starting out on that journey? The following are proven components although not in a specific order.
- 86% of the attendees required a strategy. Investing between 15 & 40 days, depending on the size and complexity of the organisation, on a strategy (or a smaller health check can define a clear roadmap. The roadmap will identify some clear priorities (see Figure 1) so that the organisation can glean high value quickly with minimal expense. Undoubtedly, there are massive improvements that can be made with just a day or two of investment – remember that training gap for example?
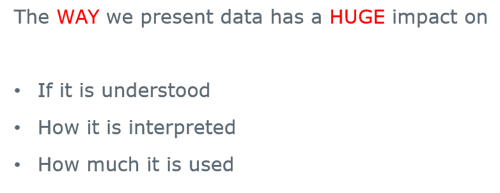
- Data Visualisation Principles Training. Perhaps the biggest bang for buck amongst these bullet points. The vast majority of professional data analysts have not had training of this mature let alone the amateurs. The result is poor data presentation is, unfortunately, the norm and consequently the message can be misunderstood, misinterpreted or not even read. See Figure 2 (courtesy of Stephen Few[i]).
- Data modelling. Data needs to be prepared in such a way that reporting becomes simple and performant. Data modelling is a skill that can be taught relatively quickly but requires years of practice to master. Fortunately it is a skill that is only needed on an occasional basis.
- In order to do any type of data analysis we obviously need the actual data. Extracting data, transforming and loading (ETL) it into a report ready structure is a necessary part of the process. This exercise can range from being trivial to highly complex but the latter can be tackled incrementally: Starting with something simple and building on it over time. Many tools are available to help us with the ETL process but we need to understand the principles of data modelling and the specific business problems before focussing on what tool to use. There are hybrid tools that have data visualisation and ETL capabilities (such as Tableau, Power BI and Qlik) and there are specialist ETL tools that may be needed for more heavyweight or complex data.
- Having a play with tools is fine; there are free versions for all the major players which will help give you some experience and knowledge. However, none (and I stress zero) of these tools are silver bullets (whatever the vendors may tell you!) Please do not purchase tools before you understand what it is you want and the principles of data management and analytics. There are some great tools in the market place and the costs are falling but which tool will suit you best is a cause for some deliberation, a tool selection exercise or a proof of concept.
- Software Training. Specific tool training comes in many flavours from interactive on line courses, to custom built training tailored for your staff and industry. At one end of the spectrum training is free but if you wanted custom-built classroom courses they can cost a significant amount. There are also books and standard training courses. A mixture of some standard or free training followed up with on the job coaching is probably the most effective and economical route.
- Ongoing commitment and development. Data and Analytics is not just for Christmas! It needs to be an established business function that is adequately funded like our HR and finance departments. We should continually revisit our priorities and embark on work packages that will produce automated reporting for the next targeted subject area. Additionally, business processes and objectives will change and our dashboards will need tweaking or redesigning to keep pace with that change.
You may be able to create an effective team with in-house resources, you may want to outsource or recruit new resources or a mixture. We find that a mixture works well. It is doubtful that you have the skills you need (or you would not have read this far!) nor, it follows, are you likely to have the skills to recruit the right staff. Getting external help to start with, where that help includes training and coaching and helping to shape and recruit a permanent team, is a strategy that many of our clients adopt. They often become self-sufficient in a relatively short period of time and are then no longer reliant on our expertise.
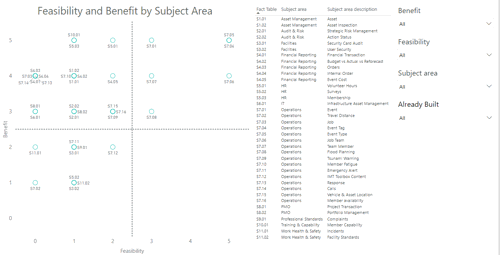
Figure 1

Figure 2
Is this better?

Understanding what types of chart and indicators to use, when and how to use colour and how the brain processes images will dramatically improve report effectiveness and the basic principles can be taught in a day! As Stephen Few puts it:
And Carla Fiorina, executive and president of Hewlett-Packard Co in 1999, chair in 2000 states: “The goal is to transform data into information, and information into insight.”
To which I would add:“So we can make better informed decisions”.
It was a pleasure to present at the webinar and I am happy that the vast majority of the attendees found it useful and were able to take something away. What pleases me even more is to witness change in an organisation and to see internal capabilities maturing. I would love to hear your stories and suggestions and I am more than happy to pay you a visit to explore some of the themes covered above in greater depth and how they may relate to your organisation.
Since 1998, Altis have been deploying our skills in Business Intelligence, Analytics and Data Management to deliver successful outcomes for our clients by helping them maximise business performance.
Much of an organisation’s operational efficiency can be gleaned from accurate and insightful reporting. Altis look to combine and analyse data in new and creative ways, giving customers the power to make better informed decisions and manage their business performance more effectively.
[1] Stephen Few has worked for over 25 years as an information technology innovator, teacher, and consultant. As the principal of the consultancy Perceptual Edge, he focuses on practical uses of data visualisation to explore, analyse, and present quantitative business information. He lives in Oregon, USA.

Ian Stuart is a Principal at Altis Consulting (www.alitsglobal.co.uk). Ian joined Altis Consulting’s UK office in August 2015. He has a wealth of experience as a consultant and solution architect of building large scale data warehouses, data management systems and reporting & analytics solutions. Ian also has expertise in training and developing generic and bespoke data warehouse architectures and methodologies and he also teaches data visualisation principles. Additionally, he has over 30 years of project management experience in the IT and construction sectors.
He lives with his wife in Kent and has three grown up children. In his spare time Ian is a keen paraglider pilot and he has been known to tread the boards in some amateur dramatics productions.
0 comments
Log in to post a comment, or create an account if you don't have one already.